
Carbon Footprinting in the Food Industry
Climate assessments of agricultural holdings as part of the Mutterkuh Schweiz (Beef Cattle Switzerland) and Silvestri AG label programmes
Context
The farming sector is facing an increasing number of challenges, particularly with regard to climate change mitigation and sustainable production. In order to ensure that your farm is future-proof and can operate successfully in the long term, it is important to carry out a sound climate assessment. This will help you to identify and reduce emissions in a targeted manner and exploit potential for sustainable optimisation.
To support farmers on this important journey, organic inspection body bio.inspecta and its market partners, Mutterkuh Schweiz (Beef Cattle Switzerland) and Silvestri AG, developed climate programmes to calculate climate footprints and reduce emissions.
Together, we can create a viable, forward-looking farming sector! We would like to take this opportunity to share with you the most important results from 2024.
Projects
In collaboration with Mutterkuh Schweiz and Silvestri AG, bio.inspecta developed climate programmes which are now being successfully implemented. Over a four-year period, these programmes will calculate the carbon footprint of all 1,127 farms producing for the Natura-Beef Bio (Natura organic beef) or Silvestri Bio-Weiderind (Silvestri organic pastured beef) labels, with calculations completed for 25% of farms in 2024.
On this basis, climate measures to reduce emissions and store carbon can be discussed and implemented over the coming years. The measures implemented are also taken into account for the farm’s climate certificate. Farms that have already implemented climate measures will receive a “CO2-reduced” certificate in recognition of their achievements. This applies not only to the farms themselves, but also, under certain conditions, to the label under which they produce, thus demonstration the label programmes’ commitment to setting a positive example and realising their potential for mitigating climate change.
Cattle farming is a major farm enterprise on all farms included in these label programmes.
Focus on food, emissions and carbon sinks
The production of food inevitably results in emissions. Every area of a farm contributes to its carbon footprint, from machinery and farm inputs to livestock husbandry and the use of fertilisers. However, alongside emissions reductions, there is also significant potential for carbon storage. Through measures such as agroforestry systems, humus build-up or the use of plant-based biochar, farms can actively contribute to reducing CO₂ emissions.
These emissions and carbon sinks are juxtaposed to determine the overall carbon footprint. This can be reduced through targeted climate measures, which many farms are already implementing. The World-Climate Farm Tool, developed by Carbon Standards International (CSI), is gaining ever more importance and acceptance in farming practice. It allows for the emissions from different farm enterprises and processes, as well as their origins, to be correctly reflected. Emissions and carbon sinks are calculated in tonnes of CO₂ equivalent, according to two internationally recognised metrics. As well as calculating the overall farm carbon footprint, the WCFT calculates emissions for various processes, livestock categories and arable crops. Individual product carbon footprints, such as for meat (based on live weight) or milk (bovine), can then be derived from these emissions. The product carbon footprint indicates the farm-gate emissions generated during production on the agricultural holding per kilogramme of product leaving the farm.
Measures to reduce on-farm emissions
Measures to reduce or offset emissions are an important tool for tackling the main sources of emissions. Emissions are offset through carbon storage measures.
Using the Farm Tool, farms can collect “climate points” for the measures they are already implementing and those they will implement in the coming year. They can choose from a catalogue of 48 measures in areas such as livestock husbandry, crop production and farmyard manure management. Each measure is assigned a number of climate points.
If a farm achieves sufficient climate points, it can be awarded a CO₂-reduced certificate. The same applies to the label if a sufficient number of its farms implement measures. This adds value for both the farms and the label when marketing their products, reflecting their commitment to climate-friendly farming.
Good to know
A carbon footprint does not constitute a judgement as to whether a farm performs well or poorly. Rather, it identifies the significant sources of emissions and carbon sinks on the farm. Some processes, such as livestock husbandry, cannot be completely emissions-free.
As a general principle, emissions from fossil fuels must be reduced in the long term in order to consistently counteract global warming. Carbon dioxide emissions from crude oil and natural gas remain in the atmosphere for more than 1,000 years, so they must in future be significantly reduced or avoided wherever possible.
GWP100 and GTP100 are two scientifically recognised metrics for measuring greenhouse gases which produce different results. GWP100 is the more established metric and is used for reporting purposes. GTP100 assigns significantly lower climate potency to short-lived greenhouse gases, such as methane.
Important findings
- The organic farms that have been included in the carbon footprinting programmes so far are cattle farms. The animals are mainly fed grass produced on-farm. Only small amounts of feed are purchased, and the circular economy results in low emissions from purchased agricultural inputs, such as fertilisers and crop protection products.
- The main sources of emissions on farms are livestock husbandry, fuel consumption and soil-borne emissions. Pasture management and site-appropriate farming practices and enterprises help minimise these sources of emissions.
- Most farms sequester CO₂ annually in carbon sinks, important examples of which are trees, agroforestry plots and hedgerows, as well as the use of plant-based biochar.
- Some farms consume very little electricity, while others generate their own, for example with photovoltaic systems.
- Many farms are already implementing targeted climate measures to improve their carbon footprint. These measures are weighted and recognised with “climate points”. These include, among others:
- Renewable electricity generation
- Preservation/establishment of standard trees and hedges
- Green manures
- Increased grazing times
- Covered slurry storage, appropriate application methods and timing of livestock farm waste
- Co-operative use of farm machinery
- Recycling of silage plastic
Overall farm carbon footprint
The 228 farms for which carbon footprinting was conducted in 2024 are primarily grassland farms dedicated to cattle rearing. This is reflected in the distribution of animal and area data, as well as in the breakdown of emissions per enterprise.
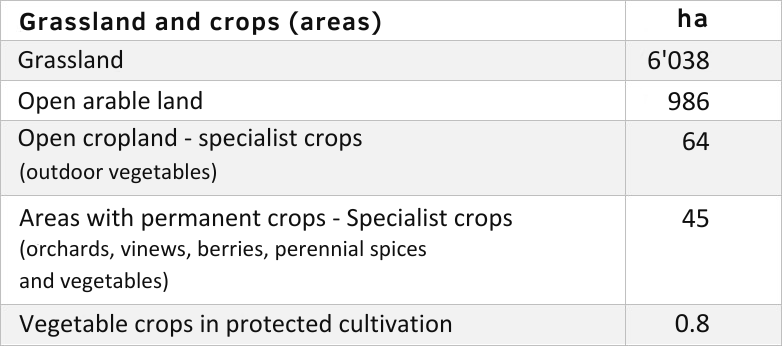
Framework data on animal numbers and areas
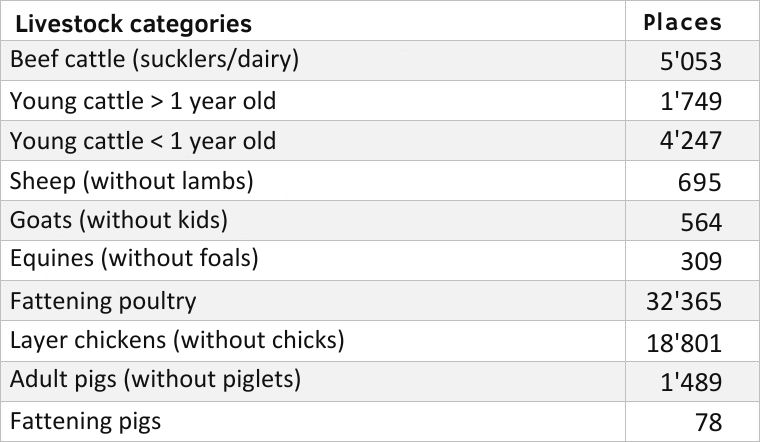
Fig. 1: Total number of animals and total areas for the farms
Average farm emissions by process - GWP100 and GTP100 metrics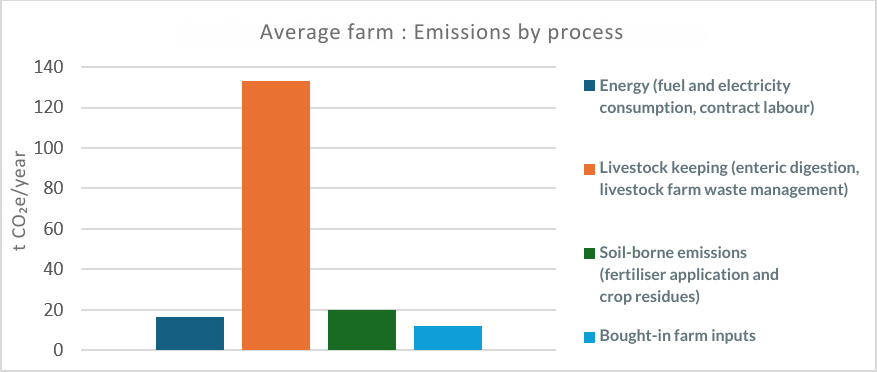
Fig. 3: Average farm emissions categorised by process, GWP100 climate metric
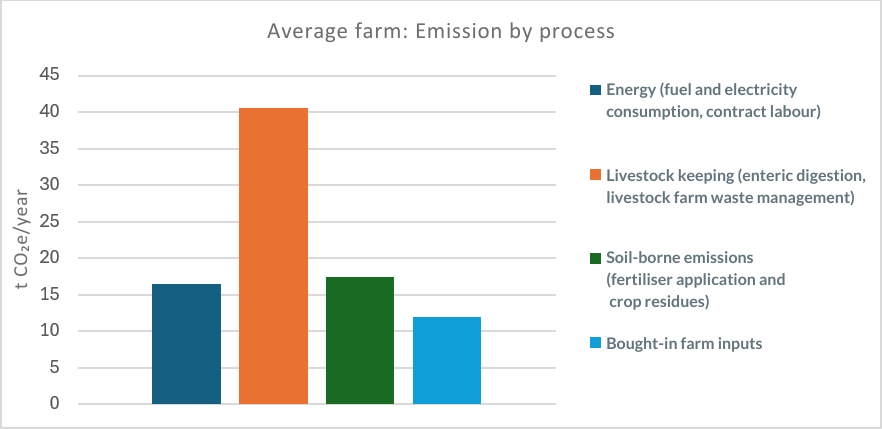
Fig. 4: Average farm emissions categorised by process, GTP100 climate metric
The largest proportion of emissions on farms with cattle enterprises is generated by the livestock enterprise. The GTP100 metric assesses methane emissions from livestock husbandry differently. This difference can be seen when comparing the two charts.
Average emissions and carbon sinks of farms by altitudinal zone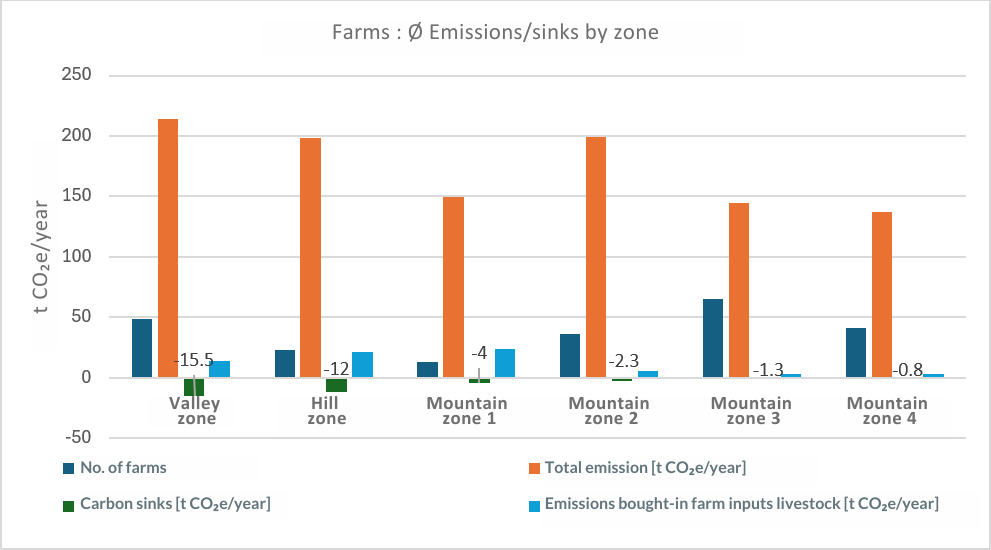
Fig. 5: Average emissions and farm carbon sinks by altitudinal zone, GWP100 climate metric
- Average emissions and carbon sinks vary depending on the altitudinal zone.
- On average, farms in the valley zone have more carbon sinks. This is because additional climate measures, such as the use of green manure, can be implemented in arable farming, and standard trees are more prevalent.
- On average, farms in mountain zone 1 and the hill zone purchase more farm inputs, such as feed and seed. Purchases of farm inputs are generally lower on the carbon-footprinted organic farms than on the conventional farms.
Suckler cow: average emissions in % and absolute distribution by process
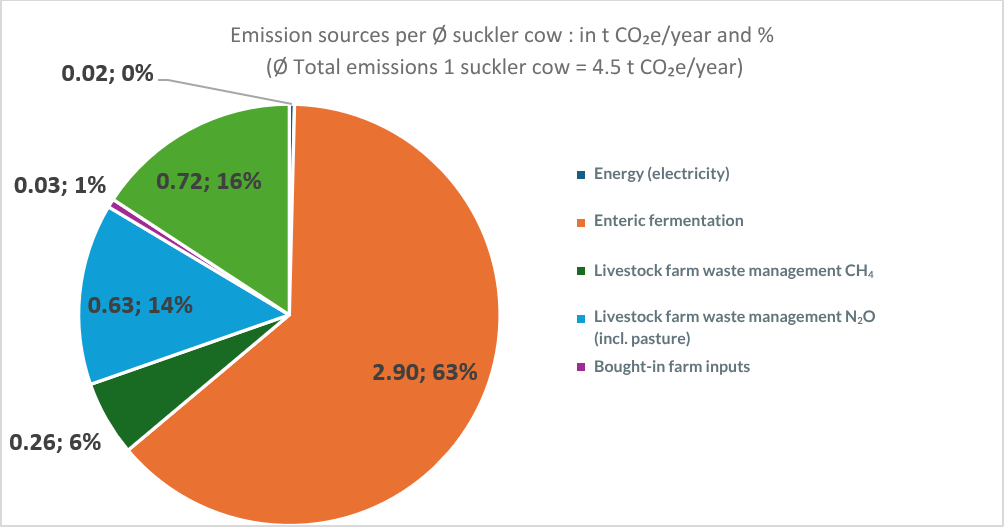
Fig. 6: What emissions are attributed to a suckler cow and what are their sources (in units of CO2e/year and as a percentage), according to the GWP100 climate metric?
On average, a suckler cow produces 4.5 tonnes of CO₂e/year. In addition to enteric digestion, which accounts for 2.9 tonnes of CO₂e/year (63%), the main contributors in suckler cow enterprises are livestock farm waste management (14%) and on-farm feed production (16%). Energy (electricity) usage has a negligible impact in this farming enterprise.
Outlook and further information
The project will continue over the coming years and all 1,127 participating farms will be assessed at least once in the 4-year period. We would be happy to provide you with further information. You can contact us by Email or simply give us a call.